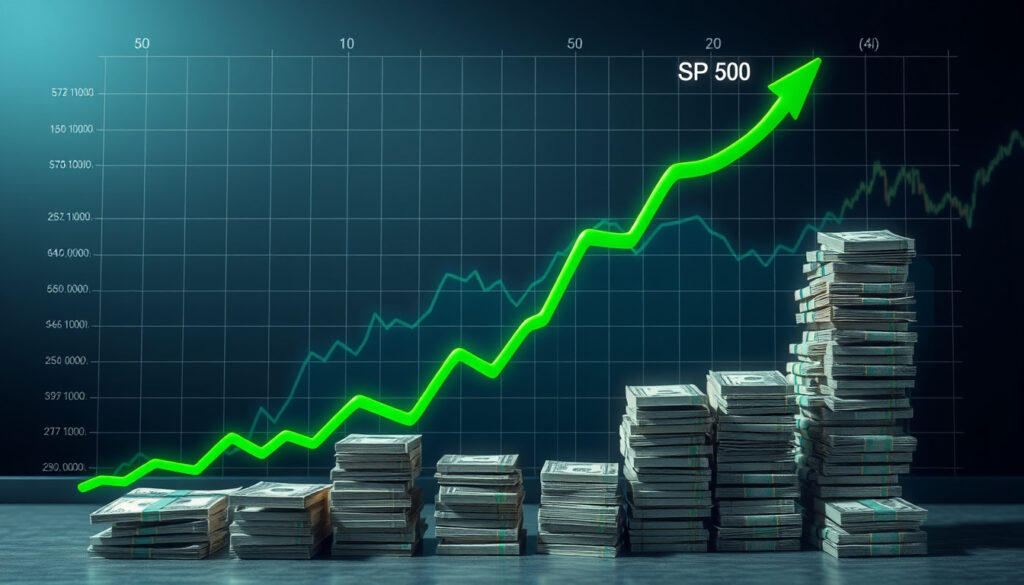
S&P 500: Returns If You Invested $1,000 10/20 Years Ago
There’s a reason Warren Buffett keeps recommending the same investment to everyday investors: the numbers tell a story that’s hard to ignore. Since 1965, the S&P 500 has averaged 10% annually — and if you’d invested $1,000 a decade ago, you’d be looking at substantially more than you started with. This guide walks through what the S&P 500 actually is, how it has performed across different periods, and why one of the world’s most successful investors thinks it’s the right starting point for most people.
Current Value: 7,126.06 · Companies Included: 500 · Market Coverage: 80% of large-cap U.S. equities · Top Source: S&P Dow Jones Indices · Recent Change: +1.20%
Quick snapshot
- Tracks 500 leading U.S. companies (S&P Dow Jones Indices)
- Covers approximately 80% of large-cap U.S. equities (S&P Global)
- Precise future predictions for 2026 remain uncertain (Financial Analysis)
- Individual return outcomes depend heavily on entry timing (Financial Analysis)
- Index launched in 1957, now 67+ years of track record (S&P Dow Jones Indices)
- Markets are cyclical with growth, stagnation, and recovery periods (S&P Dow Jones Indices)
- Buffett recommends low-cost S&P 500 index funds for long-term investors (YouTube: Buffett’s Advice on S&P Returns)
- Probable 10-year returns estimated between -1% and +7% (midpoint ~3%) (YouTube: Buffett’s Advice on S&P Returns)
The table below summarizes key specifications and data points for the S&P 500 index.
| Label | Value |
|---|---|
| Index Symbol | ^GSPC |
| Provider | S&P Dow Jones Indices |
| Launch Year | 1957 |
| Market Cap Coverage | 80% |
| Recent Close | 7,126.06 |
What does the S&P 500 stand for?
The S&P 500 — formally the Standard & Poor’s 500 — is a market-capitalization-weighted index that tracks 500 leading publicly traded U.S. companies. Think of it as a snapshot of how the largest chunk of American business is performing at any given moment. S&P Dow Jones Indices maintains the index, selecting companies based on market cap, liquidity, and sector representation.
Overview of the index
What makes the S&P 500 the benchmark most professional investors compare themselves against is its coverage. Those 500 companies represent about 80% of the total market value of all U.S. large-cap stocks, according to S&P Global. When you hear that “the market is up today,” the reference is usually this index.
Companies included
The index isn’t static — companies get added and removed based on criteria like market capitalization and trading volume. The constituents turnover around 3.5% per year, meaning roughly 17-18 companies get replaced annually. This keeps the index fresh without destabilizing it.
For investors, that steady turnover means the S&P 500 always reflects the most relevant large-cap companies. It’s not stuck in 1957 with the original constituents — it evolves with the economy.
What if I invested $1000 in S&P 500 10 years ago?
Historical performance offers one lens into what long-term S&P 500 investing actually looks like. Looking at specific decades helps illustrate both the potential and the variability:
Historical performance calculation
The S&P 500 has posted dramatically different returns depending on which decade you examine. From 1938 post-Great Depression, $10,000 grew to $81,000 in a decade at 25% annual returns — though that period isn’t typical. Post-WWII starting 1948, the same $10,000 grew to $62,000 at 20% annually.
More recent decades show more modest results. The 2008 Great Recession decade delivered approximately 0% returns, leaving investments flat. During the 1998 tech boom period, the S&P 500 posted just 3% annual returns, turning $10,000 into $13,439.
Key factors influencing returns
Multiple factors shape decade-by-decade performance: economic conditions, inflation rates, interest rates, and market valuations at entry. Markets are cyclical with periods of explosive growth, stagnation, and recovery. What looks like a disappointing decade often sets up stronger subsequent returns.
The decade with the worst returns (2008-2018) started at the worst possible moment — just before the financial crisis. Yet investors who held through it eventually recovered and saw positive long-term results.
What if I invested $1000 in the S&P 500 20 years ago?
Twenty-year horizons smooth out some of the decade-by-decade volatility and show more of what long-term ownership actually delivers.
Long-term growth example
Berkshire Hathaway under Warren Buffett has averaged 19.8% annual return since 1965, compared to 10% for the S&P 500 over the same period, according to investor analysis. The Dow Jones itself went from 66 to 11,497 across the 20th century with rising dividends — illustrating the compounding power over extended holding periods.
Buffett’s own portfolio tracks the S&P 500 closely because he allocates 90% to Vanguard S&P 500 index funds (VFIAX or VOO). His reasoning: for non-professionals, buying and holding a broad index fund while avoiding frequent trading is the path most likely to capture market returns rather than surrender them to fees and taxes.
Comparison to other periods
Historical data from backtests shows the Buffett 90/10 portfolio (90% stocks, 10% bonds) outperforming both a traditional 60/40 portfolio and the S&P 500 in historical comparisons, according to Curvo portfolio backtests. From 1987, Buffett’s portfolio approach achieved 11.64% CAGR versus 9.94% for a traditional 3-fund portfolio with the same contribution assumptions.
Is the S&P 500 still a good investment?
This is the question every current or potential investor faces. The honest answer depends on time horizon, risk tolerance, and expectations.
Current market context
The S&P 500 cap-weighted index probable total return over the next 10 years is estimated between negative 1% and positive 7%, with a midpoint around 3%, according to financial analysis. That’s lower than historical averages and lower than what investors might expect based on long-term memories of the index’s performance.
Buffett holds $300 billion in cash reserves, reportedly waiting for attractive valuations during corrections. This suggests even legendary investors see uncertainties ahead — but it also shows disciplined capital allocation matters more than ever.
Pros and cons
Upsides
- Broad diversification across 500 companies
- Low-cost index funds available (expense ratios under 0.10%)
- 67+ years of proven long-term growth trajectory
- Buffett endorses it specifically for non-professional investors
- Automatic rebalancing as index composition changes
Downsides
- Returns vary dramatically by decade — expect volatility
- Some decades (2008-2018) delivered flat or negative results
- Future returns estimated lower than historical averages
- Market exposure means drawdowns during recessions
- Passive approach means missing sector winners/single-stock gains
What does Warren Buffett think of the S&P 500?
Warren Buffett has been remarkably consistent over decades in his advice to everyday investors: start with a low-cost S&P 500 index fund and stay the course. Buffett’s endorsement of the S&P 500 for everyday investors is well-known, and you can find more details on the $USD to CAD exchange rate and its historical performance.
Buffett’s advice for new investors
“In aggregate, American business has done wonderfully over time and will continue to do so (though, most assuredly, in unpredictable fits and starts),” Buffett wrote. His strategy centers on buying great businesses with economic moats — brand power, cost advantages, network effects — and holding them indefinitely to compound returns.
For non-professionals who lack the time or expertise to analyze individual companies, Buffett’s explicit recommendation is a low-cost S&P 500 index fund. His own will directs that 90% of his wife’s inheritance go to an S&P 500 index fund.
His recommended strategy
Buffett portfolio allocation: 90% Vanguard S&P 500 (VFIAX or VOO), 10% short-term bonds. The thinking: bet on American business over time, accept market volatility, and avoid the temptation to trade in and out. His famous principle — “Be fearful when others are greedy, and greedy when others are fearful” — guides when he deploys Berkshire’s capital, but for index fund investors, staying invested regardless is the simpler path.
Buffett’s endorsement isn’t marketing — it’s the strategy he explicitly chose for his own family. The 90/10 split he recommends for his heirs reflects how confident he is that broad U.S. market exposure, held long enough, compounds wealth reliably.
“In aggregate, American business has done wonderfully over time and will continue to do so (though, most assuredly, in unpredictable fits and starts).”
— Warren Buffett, Investor
“Be fearful when others are greedy, and greedy when others are fearful.”
— Warren Buffett, Investor
For U.S. investors evaluating the S&P 500 today, the choice is straightforward: accept that future returns will likely be more modest than historical averages, remain diversified, and resist the urge to time entry and exit points. The investors who build real wealth with this index are the ones who stay invested through recessions, corrections, and flat decades.
How much would $10,000 invested in the S&P 500 in 2000 be worth today?
The 2000s proved challenging — the dot-com crash and 2008 financial crisis delivered roughly flat returns across that decade. However, investors who held through both crashes and the subsequent recoveries have generally seen meaningful growth. Exact values depend on specific entry/exit dates, but the 20+ year horizon historically rewards patient holders.
Can I become a millionaire by investing in the S&P 500?
Starting early with consistent contributions, yes — the compounding effect over 30+ years can turn moderate monthly investments into seven figures. Someone investing $500/month at a 10% average return would reach $1 million in approximately 26 years. The key variables are: starting age, monthly contribution amount, and time horizon.
How much money do I need to invest to make $3,000 a month?
To generate $3,000/month ($36,000/year) in passive income from S&P 500 index funds, you’d need roughly $900,000-$1.2 million depending on withdrawal rates and market conditions. At a 3-4% annual withdrawal rate, that’s the portfolio size required — achievable over 20-30 years with consistent investing and compound growth.
Who owns 90% of the US stock market?
Institutional investors (mutual funds, ETFs, pension funds, insurance companies) own the majority of U.S. equities — roughly 70-80% by most estimates. Individual retail investors own a smaller portion directly, though many are exposed through retirement accounts like 401(k)s that hold index funds.
Is it safe to invest in S&P 500 funds right now?
“Safe” is relative — no investment in equities is risk-free. The S&P 500 will continue to fluctuate with economic cycles. What makes index investing defensible is the long time horizon: short-term volatility averages out over 10-20 years. For investors who need money within 3-5 years, the answer is different than for those with 20+ year horizons.
What if I invested $10,000 in S&P 500 20 years ago?
A $10,000 investment in the S&P 500 approximately 20 years ago would have experienced significant growth through multiple market cycles. Starting from around 2004, an investor would have navigated the 2008 crisis, the long recovery, and the 2020 pandemic volatility — but long-term holders have historically seen their investment grow substantially, often reaching $40,000-$60,000 or more depending on exact entry timing.
Related reading: S&P 500 Futures · Comparison Car Insurance Quotes
More related posts
 RSVP Dating Site – Complete 2025 Review Guide
 John McAfee Death: Net Worth, Last Words, and Disputed End
 What Is PAYG? Pay As You Go Tax Explained for Australia
 Gerran Howell: Age, Partner, The Pitt, Movies & Welsh Background
 Mo Salah Transfer News: Contract, Future, World Cup
 Paige Greco: Australian Paralympic Cyclist Dies at 28
 Matt Walsh: Children, Wife, Religion, and Education Facts
