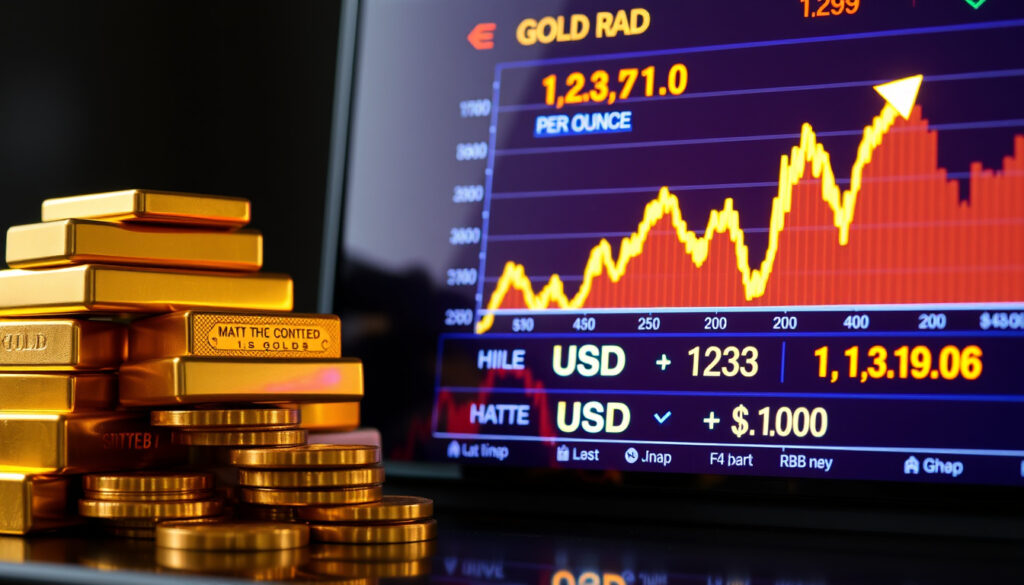
Gold Spot Price: Live Chart, USD per Oz & Gram Today
Few financial instruments capture global anxiety and optimism quite like gold. When investors get nervous, they reach for the yellow metal; when currencies wobble, gold holds its ground. That is why the gold spot price moves so visibly in response to geopolitical shocks, inflation reports, and central bank decisions. This piece walks through the live spot price, the charts that track it, and the historical milestones that put today’s numbers in context.
Benchmark: LBMA Gold Price (twice daily) · Primary Unit: USD per troy ounce · Key Markets: New York, London, Hong Kong, Sydney · Chart Sources: Kitco, TradingView, BullionVault · Related Metal: Silver spot price
Quick snapshot
- LBMA Gold Price set twice daily at 10:30 and 15:00 GMT (LBMA)
- Spot gold quoted in USD per troy ounce (JM Bullion)
- Live charts on BullionByPost update every 5 seconds (BullionByPost)
- Exact intraday highs and lows without a live feed (BullionByPost)
- Future price direction — gold remains volatile (Trading Economics)
- Past month: 8.44% rise (Trading Economics)
- Year-over-year (2026): up 43.28% (Trading Economics)
- Next LBMA Gold Price fix at 10:30 GMT, 15:00 GMT (LBMA)
- Watch central bank announcements and inflation data for near-term direction (World Gold Council)
These figures form the backbone of how traders and investors track gold’s value across markets.
| Label | Value |
|---|---|
| Definition | Price for immediate gold delivery |
| Standard Unit | Troy ounce |
| Currency | USD |
| Benchmark | LBMA Gold Price |
| All-time high | $5,608.35 USD/t.oz (January 2026) |
| Key recent peak | $3,004.71 (March 14, 2025) |
Gold spot price chart
Live charts are the fastest way to track the gold spot price as it moves through the trading day. BullionByPost updates its display every 5 seconds, pulling quotes from New York, London, Hong Kong, and Sydney markets. Kitco offers a 24-hour bid/ask chart that reflects the spread between what buyers are willing to pay and what sellers accept.
Live charts from Kitco and TradingView
Kitco Gold Charts aggregates spot prices from the major markets, displaying a real-time line that updates throughout the session. Trading Economics provides a cleaner interface with overlay options for moving averages and year-to-date performance. Investors who prefer interactive charting tools can use TradingView to draw support and resistance levels directly on the live spot price data.
Historical price trends
Looking back, gold climbed past $2,000 per ounce for the first time in August 2020 as the Covid-19 pandemic intensified (BullionVault). It then set fresh records during the Russian invasion of Ukraine starting in late February 2022 (BullionVault). The metal continued its bull run until May 20, 2024, when spot gold peaked at $2,450 per troy ounce (APMEX).
Real-time updates
Prices vary slightly across platforms because each source reflects its own bid/ask spread and market depth at the moment of capture (BullionByPost). That gap can be meaningful when you are buying or selling a large position. The most authoritative reference remains the LBMA Gold Price, set at the twice-daily London auction.
Gold spot price history
Gold has a longer price record than almost any other asset. GoldPrice.org traces its chart back to the British Official Price of 1257. More practically, World Gold Council publishes monthly, quarterly, and annual gold price averages in major currencies since 1978.
Monthly and yearly trends
As of April 21, 2026, gold traded at $4,780.38 per troy ounce — down 0.84% on the day but up 43.28% year-over-year (Trading Economics). The same platform recorded a price of $4,833.56 per ounce on April 17, 2026 (Trading Economics). Those figures illustrate both the volatility and the strong longer-term momentum that has defined gold in the 2020s.
LBMA benchmark evolution
The London Bullion Market Association (LBMA) oversees the oldest and biggest gold financial market, publishing official prices that anchor global trading (LBMA). Its Trade Data initiative makes it possible for market participants to gauge the size and shape of the London OTC precious metals market for the first time in history (LBMA). On April 17, 2026, the LBMA Gold PM fix was $4,870.50 (LBMA).
Key price movements
The most significant recent milestones include $3,004.71 on March 14, 2025, when gold spiked on tariff uncertainties (APMEX), and an all-time high of $5,608.35 in January 2026 (Trading Economics). Before that, the previous record of $2,450 occurred on May 20, 2024, reacting to the death of Iran’s President (APMEX).
Gold spot price per gram
Most retail gold products — bars, coins, jewelry — are priced by gram, but the spot market runs in troy ounces. Converting between the two takes a simple formula: divide the USD/oz price by 31.1035 (the number of grams in a troy ounce).
Conversion from troy ounce
At a spot price of $4,830 per ounce, the gram equivalent is roughly $155.30 per gram. Markets Insider displays a live conversion showing gold at 145.14 USD per gram alongside the ounce price. Knowing both figures helps when comparing dealer premiums on small bars versus one-ounce coins.
Current gram pricing
Live gram rates appear on most bullion dealer websites alongside the ounce price. BullionByPost shows both in its live widget, updating with each market tick. This is useful when you want to estimate the gold content value of scrap jewelry or small collectible bars.
Regional variations
LBMA provides its official gold price in USD, GBP, and EUR, enabling conversions for buyers in the UK and Eurozone (BullionByPost). Regional premiums and taxes add to the final purchase price, so the spot gram rate is only the starting point.
Gold spot price oz
The troy ounce is the standard unit for all official gold pricing worldwide. Unlike the avoirdupois ounce used in grocery stores, a troy ounce equals 31.1035 grams. Every quote you see from LBMA, APMEX, or Trading Economics is expressed in troy ounces.
Troy ounce standard
The troy system dates back to medieval trade fairs in Troyes, France, and the London gold market adopted it centuries ago. JM Bullion notes that the gold spot price forms the basis for how bullion dealers price their entire inventory in troy ounces.
USD per oz live
The most current LBMA Gold AM fix on April 17, 2026, was $4,795.85, while the PM fix came in at $4,870.50 (LBMA). These are the benchmarks that settle derivatives contracts and guide physical market pricing globally.
Market quotes
Individual dealer quotes will differ slightly from the LBMA fix due to handling fees, shipping costs, and regional demand. BullionByPost tracks this spread in real time, showing how far the retail ask sits above the spot bid.
Gold spot price USD
The USD/t.oz rate is the global default for gold trading. LBMA publishes its official gold price in US dollars, British pounds, and euros twice daily. Most investors and dealers outside the UK default to USD because it provides the most liquid and transparent benchmark.
USD/t.oz quotes
On the morning of April 17, 2026, gold traded at $4,830.39 per ounce on JM Bullion’s platform, up 39% year-over-year. Trading Economics showed a simultaneous quote of $4,833.56, reflecting the narrow spread between competing market feeds.
Daily fluctuations
Gold’s daily move depends on the dollar’s strength, real interest rates, and risk appetite. A stronger dollar typically pushes gold down; a weaker one lifts it. World Gold Council publishes monthly data that smooths these daily swings into longer-term trends, useful for strategic allocation rather than day trading.
Benchmark fixes
The LBMA Gold Price is determined via a globally coordinated auction process that brings together the largest gold dealers (APMEX). The fixings at 10:30 and 15:00 GMT serve as the reference rate for contracts worth billions of dollars in physical and derivative markets.
Spot gold peaked at $2,450 per ounce on May 20, 2024 — yet that peak was surpassed three more times in 2025–2026, reaching $5,608.35 in January 2026. Investors who entered in early 2025 at under $3,000 have already seen gains exceeding 80%.
The LBMA Gold Price fix at 10:30 and 15:00 GMT is the global benchmark that settles contracts worth billions. Every $10 move in that fix ripples through futures, options, and physical dealer pricing worldwide.
Timeline
Six moments define gold’s recent trajectory from $2,000 to $5,600 per ounce:
- August 2020: Gold crossed $2,000/oz for the first time as Covid-19 rattled global markets (BullionVault)
- August 7, 2020: Spot gold hit $2,074/oz during the pandemic surge (APMEX)
- Late February 2022: Gold set fresh all-time records during Russia’s invasion of Ukraine (BullionVault)
- May 20, 2024: Spot gold peaked at $2,450/oz following Iran’s President’s death (APMEX)
- March 14, 2025: Gold reached $3,004.71 on tariff uncertainty headlines (APMEX)
- January 2026: All-time high of $5,608.35 recorded on Trading Economics (Trading Economics)
Confirmed facts
- LBMA Gold Price set twice daily at 10:30 and 15:00 GMT
- Spot gold quoted in USD per troy ounce
- Live charts on BullionByPost update every 5 seconds
- Gold priced above $2,000/oz first in August 2020
- All-time high of $5,608.35 in January 2026
- $3,004.71 reached on March 14, 2025
What’s unclear
- Exact intraday highs and lows without a live feed
- Future price direction — gold markets remain volatile
Expert perspectives
Gold priced in US Dollars rose above $2,000 per ounce for the first time in August 2020, jumping as the Covid-19 pandemic and subsequent global economic crisis drove investors to seek safety in physical bullion.
— BullionVault (Bullion Platform)
This bull run continued until May 20, 2024, when spot gold peaked at $2,450 per troy ounce as investors reacted to the death of Iran’s President.
— APMEX (Bullion Dealer)
For the first time in history, LBMA Trade Data makes it possible for market participants to gauge the size and shape of the London OTC precious metals market.
— LBMA (Precious Metals Authority)
For investors weighing physical gold, the choice is becoming clearer: hold a portion of liquid savings in gold now, or wait for higher entry points as demand from central banks and retail buyers continues to compress supply. Those who entered in early 2025 at under $3,000 have already seen gains exceeding 80%.
Related reading: S&P 500 Futures – Current Price Chart Trading Guide
While monitoring USD benchmarks like LBMA, the live USD gold price per gram provides essential granularity for ounce-to-gram conversions.
Frequently asked questions
What determines the gold spot price?
The gold spot price reflects the agreed rate for immediate gold delivery between buyers and sellers. It is anchored by the LBMA Gold Price twice-daily fix and moves throughout the day based on currency strength, real interest rates, geopolitical risk, and physical demand from central banks and jewelers.
How does gold spot price differ from gold futures?
The spot price is for immediate delivery, while a futures contract locks in a price for gold to be delivered on a set future date. Futures include a “contango” premium that reflects storage and financing costs. When the market is in “backwardation,” futures trade below spot.
What is the LBMA Gold Price?
The LBMA Gold Price is the global benchmark for gold, set twice daily at 10:30 and 15:00 GMT through an electronic auction among the largest gold dealers. It is published in USD, GBP, and EUR and used to settle over-the-counter and exchange-traded contracts worldwide.
Why use troy ounces for gold spot price?
The troy ounce (31.1035 grams) is the standard unit for all precious metals pricing, inherited from the medieval Troyes trade fairs and adopted by the London Bullion Market. It provides a universal reference so that buyers and sellers anywhere in the world quote the same quantity.
How to convert gold spot price to grams?
Divide the USD per troy ounce price by 31.1035. For example, at $4,830/oz, the gram price is approximately $155.30/g. Most bullion dealer sites display both values automatically.
What influences daily gold spot price changes?
Daily moves are driven primarily by the US dollar’s strength (inversely), real interest rates (negatively when rates rise), central bank purchases, geopolitical shocks, and inflation expectations. Physical demand from Asia, especially China and India, also moves the market.
Where to track gold spot price live?
BullionByPost updates every 5 seconds and displays a live chart alongside the current spot rate. Kitco offers 24-hour bid/ask data across New York, London, Hong Kong, and Sydney. TradingView provides interactive charting tools. The most authoritative reference is the LBMA Gold Price itself.
More related posts
 Rick Springfield: Biography, Net Worth, and Top Songs
 Guy Ritchie: Biography, Career, Personal Life, and Net Worth
 Ed Craven: Net Worth, Biography, and How He Built His Fortune
 Glenn McGrath: Where He Lives, Job Loss, Wife, Children & More
 What Is a Fermented Food? Benefits, Examples, and Risks
 Range Hood: Vented vs Ductless – Cost, Code & Health
 June Lockhart Dies at 100: TV Mother of Lassie, Lost in Space
 Comparison Car Insurance Quotes – Save Hundreds Yearly
